

Google knows if you have the flu. Using their ocean of data, the stat-heads built a model that essentially predicts a person’s liklihood of having the flu based on their search terms. This model could save lives. By quickly identifying a city that has a high likelihood of a flu outbreak, Google could warn the Centers for Disease Control, and then the CDC, in turn, could deploy resources before people get sick.
There’s only one tiny problem: The model didn’t work. After some promising early results, in 2013, the data predicted twice the amount of flu cases as actually happened. “Google’s model was way off the map,” says Dr. Yang Sun, Associate Professor of Supply Chain Management at Sacramento State University and an expert in big data. “The traditional method gave better results than Google’s algorithm. People are selling big data solutions all over the place, but it’s not a silver bullet that can solve all your problems.”
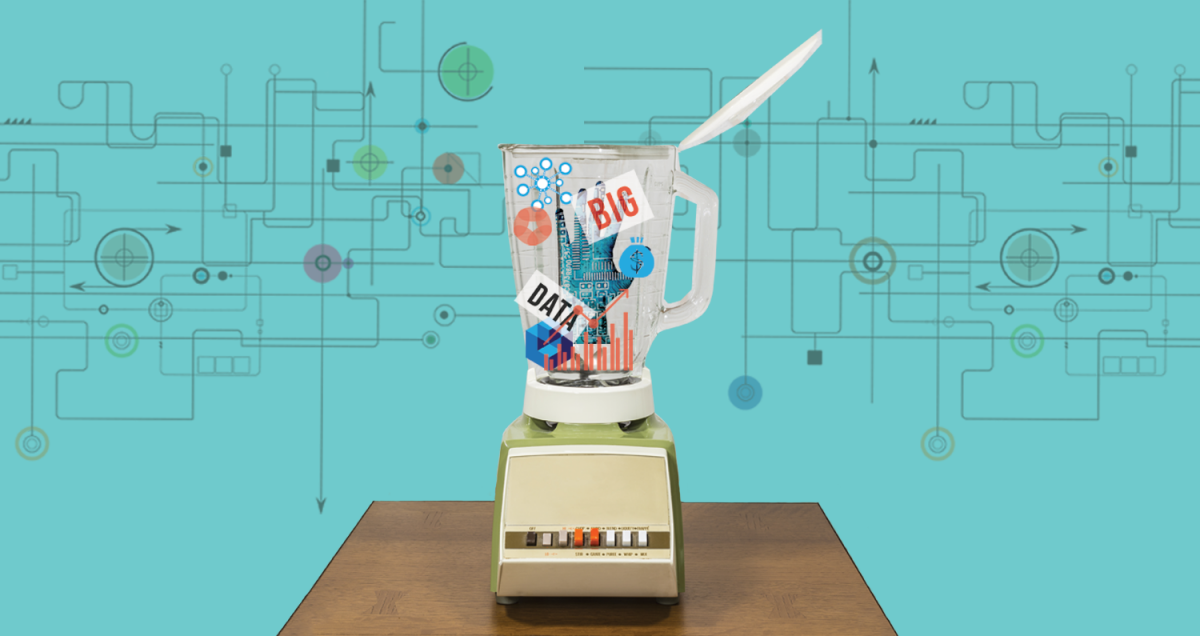
This isn’t meant to bash Google. The company remains the gold standard of big data. (The flu model has since been recalibrated.) But it illustrates that for all of big data’s hype, it comes with risks and asterisks. Big data can have real benefits, but it can also undercut common sense, frustrate employees, alarm customers and come with some hidden costs. Caveat emptor …
The Big Win
The benefits are concrete, and they’re everywhere. It’s easy to spot the wizardry of algorithms at Google, Amazon and Netflix, but even brick-and-mortars use extensive data modeling. At UPS, they used algorithms to create more efficient driving routes for their trucks, saving 3 million gallons of fuel in 2011 alone. At Walmart, the data nerds discovered that in the days before a hurricane, people were more likely to buy Pop-Tarts. Now, when a storm comes, they move the Pop-Tarts closer to the front. In St. Louis, a data consulting firm installed wireless sensors onto the engines of public buses, and this intel feeds a pool of data that predicts exactly when the buses need maintenance. They slashed costs by 10 percent.
“Data is a wonderful tool, but it’s not an absolute. When it comes to human capital, you have to take human factors into account … What data doesn’t do is provide you that emotional piece” Michael Letizia, state director,California chapter of Society for Human Resource Management
Even the softer side of business, like human resources, is turning to big data. “I’ve been in HR for 30 years,” says Michael Letizia, the state director for the California State Council of the Society for Human Resource Management. “Going from a paper-based system, then to a system like Word and Excel, to now, where it’s integrated into one enterprise solution — this has helped tremendously in cutting down the time it takes to manage personnel.” Clever manipulation of HR data could help a firm optimize payroll, evaluate performances, reduce churn and even hire new candidates.
The consulting firm Protiviti, for example, built a model to predict turnover, finding that “information such as the employee’s college major, highest degree type, number of years at previous employers, history of change in salary, industry experience and promotion history were found to be highly predictive of employee turnover,” writes Protiviti’s managing director in CFO magazine’s website. “The model is not only useful for diagnosing employee turnover in the present, but also can help predict which employee is likely to leave in the future.”
The real trick, though, is tempering these kinds of black box predictions with real human thought. “Data is a wonderful tool, but it’s not an absolute,” says Letizia. “When it comes to human capital, you have to take human factors into account.” Sure, maybe the company’s algorithm suggests that Employee #13,345 would be a good fit as an account supervisor, but what if they despise that job? “What data doesn’t do is provide you that emotional piece,” he continues.
The Hidden Costs
Putting emotions aside, there’s no guarantee that the predictions themselves are even useful. The hidden costs of big data involve a closer understanding of what, exactly, big data really means.
It helps to think about the distinction between a sampling of data and an entire population of data. Let’s pretend that you own a Sacramento-based franchise that sells paint. In the old days, you could use data analysis to look at seasonal trends, track your bestsellers and maybe uncover your top salespeople. Much of this can be done in Excel. With a larger database, you can now track every single can of paint you’ve ever sold and map the relationships of things like “shopping cart behavior,” where you analyze the revenue from customers who buy blue in tandem with red. (Your marketing director has a theory: Maybe people who buy a certain color are more likely to make a follow-up purchase, so these customers should be targeted with some kind of special coupon.) There are nearly infinite combinations of shopping cart combos, so it requires a monster database with hundreds of variables.
Excel is no longer sufficient. So you hire a data ninja who pumps these variables into the database, hunts for links between the variables and then, weeks later, provides this insight: “Women who live in Elk Grove and bought a can of paint the color of ‘Yucca White’ on a Tuesday are 17 percent more likely than the average customer to buy a second can of paint within a year.”
Now we come to the crux of the problem. Is this information useful? And what does it mean? This is a problem Sun sees frequently. “Some people rely too much on what the computer tells them,” he says. “They over-rely on a statistical model.” To hammer home the point in the classroom, he draws five points on a board for his students. “With five data points, you can see a clear trend and in the traditional model, you would simply draw a straight line to represent that trend.” So far so good. “Now you take the same five data points, but you use the computer to make a perfect fit for the trend, and it comes out to be some fourth-order polynomial. It’s a perfect fit with all the data, but a human eye could see that it’s not a good model, because it doesn’t make sense.”
This problem is related to something the statisticians call “over-fitting,” explains Yonggang Xu, Director of Data Science at Rocket Fuel, a data mining consulting firm that’s located in San Francisco. “You have so much data, and so many ways to partition the data,” Xu says. “This makes it difficult to generalize, and whenever you do find a certain combination — maybe for the historical data it works — there’s no guarantee that it’s going to work in the future.” Yes, last year the Elk Grove women bought a second bucket of paint. But is it predictive?
This strikes at big data’s next pitfall: The confusion over correlation vs causation. “The government produces data on literally 45,000 economic indicators each year; private data providers track as many as four million statistics,” says Nate Silver, founder and editor in chief of the polling aggregation website FiveThirtyEight? and the crown prince of data analysis. “The temptation that some economists succumb to is to put all this data into a blender and claim that the resulting gruel is haute cuisine.” The food turns to gruel when one variable is in fact correlated with another but it’s not clear why. Numerous studies have shown a strong correlation between violent murders and ice cream sales. Does icecream make people violent? Perhaps these trends caused by a third variable: heat. Crime is higher in the summer; people eat ice cream in the summer. When we turn the key of our analysis over to a computer, these are the insights we miss.
But according to some advocates of big data, maybe that’s OK. “We won’t have to be fixated on causality; instead we can discover patterns and correlations in the data that offer us novel and invaluable insights,” argue Viktor Mayer-Schonberger and Kenneth Cukier in their book Big Data: A Revolution That Will Transform How We Live, Work, and Think. “The correlations may not tell us precisely why something is happening, but they alert us that it is happening. And in many situations this is good enough.” This sounds like blasphemy to our cause-and-effect brains, but they do raise a provocative point. “If millions of electronic medical records reveal that cancer sufferers who take a certain combination of aspirin and orange juice see their disease go into remission, then the exact cause for the improvement in health may be less important than the fact that they lived.”
The Creepy Factor
Target is a champion of big data. In his book The Power of Habit, Charles Duhigg explains how Target wanted to boost the sales in its maternity department, so they leveraged millions of shopping cart combos to understand the buying patterns of moms-to-be. They succeeded beyond their wildest dreams. “Expectant mothers, [Target] discovered, shopped in fairly predictable ways,” writes Duhigg. “Take, for example, lotions. Lots of people buy lotion, but a Target data analyst noticed that women on the baby registry were buying unusually large quantities of unscented lotion around the beginning of their second trimester. Another analyst noted that sometime in the first 20 weeks, many pregnant women loaded up on vitamins like calcium, magnesium and zinc.” This let Target create a “Pregnancy Prediction Score.” Once Target’s algorithms intuited that a customer was pregnant, it then tailored the in-home flyers to include more items that a mom-to-be would want. It was a huge success.
“Some people rely too much on what the computer tells them. They over-rely on a statistical model.” Dr. Yang Sun, associate professor pf supply chain management, Sacramento State University
One day, an angry father lit into a Target manager, showing them one of these mom-to-be flyers. As Duhigg relays in his book, the father yelled, “My daughter got this in the mail! She’s still in high school, and you’re sending her coupons for baby clothes and cribs? Are you trying to encourage her to get pregnant?” The man went home, furious. He later called up Target and said, “I had a talk with my daughter. It turns out there’s been some activities in my house I haven’t been completely aware of. She’s due in August. I owe you an apology.”
Even when big data is at its non-creepiest best, it’s rarely cheap. Sun ballparks the initial start-up cost at half a million dollars for data storage and “grunt infrastructure.” And while it’s true that user-friendly data tools like Hadoop are trimming the learning curve, it still requires a massive investment. “Few companies have in-house experts who can even make a business case to justify the cost of hiring big-data experts, let alone assess the quality of the applicants,” argues Dr. John Jordan, a professor at Penn State University, in The Wall Street Journal. “Many managers also lack basic numeracy, so getting decision makers who can grasp more sophisticated statistical mechanics can be a challenge.”
It’s also true that too much data can be, well, a pain — even at data-happy places like Google. As Big Data reports, a top designer from Google, Douglas Bowman, was so sick of fetishizing the data, he quit. “I had a recent debate over whether a border should be three, four or five pixels wide and was asked to prove my case. I can’t operate in an environment like that,” Bowman explains on his blog. “Data eventually becomes a crutch for every decision, paralyzing the company.”
None of this is an argument for Luddism. Clearly it makes sense to use data in a smart way. But it isn’t a magic wand, it’s not cheap, and it’s not always better than our own gut instinct. As even Mayer-Schonberger and Cukier, both big data cheerleaders, observe: “If Henry Ford had queried big-data algorithms for what his customers wanted, they would have replied ‘a faster horse.’”
Comments
The teen pregnancy story has been essentially debunked: http://www.predictiveanalytics...
Thanks, Mike [Letizia] on how HR can view big data.